Efficiency Ratio Analysis
Efficiency ratio is a financial metrics that is used to measure, how well a company can use its assets and liabilities to generate income.
Business Owners, Managers, Investors and Financial lenders use it to analyze, how effectively and efficiently a company is managing its assets to produce sales.
It is also called as activity ratios.
In the case of assets, efficiency ratios compare assets to sales, or the cost of goods sold.
In the case of liabilities, efficiency ratios compare payables to total purchases from suppliers.
Efficiency ratios are most useful when they are used in comparative form.
The following metrics is used commonly to measure and manage a business:
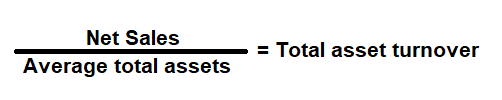
Asset Turnover Ratio
Financial metric used to measure the efficiency of a company and its management in generating income with its total assets
(all current and noncurrent assets). In other words, the ratio calculates net sales as a percentage of assets.
It shows, how many sales are generated from each dollar of assets it owns.
Formula:
How to use this equation?
The values are commonly stated against total assets in the balance and net sales in the income statement. To use this ratio, divide net sales by its average total assets.Note:
Average Total Assets: Add total assets of the current year and the total assets of the previous year, and then divide that value by 2.
Net Sales:
Total sales less returns and bad debts.
Total Assets:
Total assets are the sum of all current and noncurrent assets that a company owns.
Example:
Asset turnover ratio for a company with a net income of $500,000 and average total assets of $775,000 is 0.65:1. It means that for every dollar in assets, a company generates $0.65 in sales.
To learn more, try our - Asset turnover ratio calculator
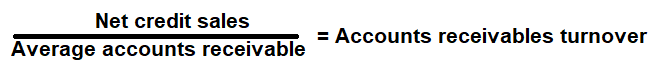
Accounts Receivable Turnover ratio
Financial metric used to measure, how well a company is at making a sale that will be collected in the future (credit sales)
and how well the company is at collecting the money that people owe it (Debtors). In other words, the ratio calculates number of times
the average value of a company's receivable turns over.
If the number is low, then the company may be having difficult time collecting
the money. We can further expand the ratio to know how many days it takes to collect the average accounts receivables turnover in days.
Formula:
How to use this equation?
The values are commonly stated against accounts receivable under current assets in the balance sheet and net sales in the income statement. To use this ratio, divide net sales by its average accounts receivable.Note:
Average Accounts Receivable (AR): Add accounts receivable of the current(ending) year and the accounts receivable of the previous (beginning) year, and then divide that value by 2.
Net Sales:
Total sales less returns and bad debts.
Account Receivable:
Account receivable is the net value of credit sales to be collected in future from its customers (Debtors).
Example:
Account receivable turnover ratio for a company with a net sales income of $360,000 and average accounts receivable of $30,000 is 12 times. It means that an average customer took 30 days to pay the company's credit sales. This metric helps a company to determine the average time it took to collect its money (AR) by dividing the Accounts Receivable Turnover Ratio/365days.
To learn more, try our - Accounts receivable turnover ratio calculator
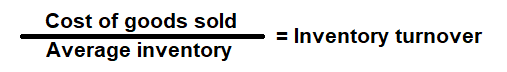
Inventory Turnover Ratio
Financial metric used to measure, how well a company generates sales from its inventory.
In other words, ratio calculates number of times a company sells and replaces its inventory during a given accounting period.
A high number means that the company cycles through its inventory very quickly, while a low number means that the inventory cycles
very slowly. We can further expand the ratio to know how many days it took to sell and replace its inventory which known as inventory turnover in days.
Formula:
How to use this equation?
The values are commonly stated against inventory in the balance sheet and net sales in the income statement. To use this ratio, divide cost of goods sold by its average inventory.Note:
Average Inventory: Add inventory values of the current (ending) year and the inventory values of the previous (beginning) year, and then divide that value by 2.
Cost of Goods Sold (COGS):
Cost of goods sold (COGS) is total cost to produce goods and services such as cost of materials, wages and other expenses related to producing a goods and service.
Inventory:
Inventory is the finished goods that can be sold immediately.
Example:
A company with a cost of goods (COGS) of $225,000, beginning inventory of $20,000 and ending inventory of $25,000 will have inventory turnover ratio of 10 times. It means that the company sold its entire inventory within 36.5 days. This metric helps a company to determine how long it will take to sell and replace its inventory and can help plan its inventory level or re-orders.