Market Value Ratio Analysis
Market value ratio is a financial metrics that is used to evaluate the value of a publicly traded company based on its reported financials and current market price. Shareholders are the people who own the company,
this metric can help identifying stocks that may be overvalued, undervalued, or priced fairly.
A wide variety of market value ratios are used to measure the current share price of a publicly traded company. These ratios check the financials of the company which are listed in the secondary market
to understand their financial position. The decision of buying and selling shares is very important and if not done at the right price then the
money invested can be wasted.
The following metrics is used commonly to measure the performance from an investor perspective:
Earnings Per Share
Financial metric used to measure a company's distribution value, or we can say, it shows how much money a company is
makes for each outstanding share of common stock.
In other words, if a company has to distrubute all of the profits, then each outstanding share of its common stock
will be allocated based on its earnings per share value.
It is also called "EPS" in short.
Companies report their earnings per share near the bottom of their income statement but
having this ratio available isn't helpful unless you know what it means.
Earnings per share is one of the many indicators used to select stocks. If a company has high earnings per share, it means it has more money
available to either reinvest in the business or distribute to shareholders.
Shareholders might be misled, if they make their investment decision only based on earnings per share and it
is important to assess the company with one or two metrics before making the buying or selling decision.
Earnings per share can be calculated in various ways, such as excluding extraordinary items or discontinued operation,
or on a diluted basis.
Formula:
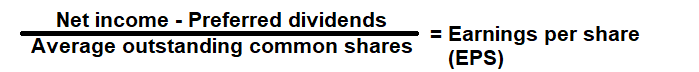
How to use this equation?
The values are commonly stated against Net Income and preferred dividend in the income statement and the weighted average shares outstanding in the balance sheet. To use this ratio, subtract the dividends paid out to preferred shareholders from the net income. Then, divide that value by average shares outstanding.Net Income:
Profit before deducting all its interest & taxes.
Preferred Dividends:
Preferred dividends are cash distributions that are paid to the owners of a company's preferred shares.
Weighted Average Share Outstanding:
Weighted average shares outstanding is a calculation that incorporates any changes in the number of outstanding shares over a reporting period.
Example:
A company with a net income of $160,000 pays out $10,000 in dividends to preferred shareholders and has a weighted average share outstanding - 50,000, then its earnings per share (EPS) will be $3.
To learn more, try our - Earnings per share calculator
Price to Earnings (P/E) Ratio
Financial metric used to measure the relationship between a company's stock price and its earnings per share.
In other words, it is the value the market is willing to pay for a stock based on its current earnings.
It is also called "P/E ratio" in short.
A high P/E ratio compared to other companies in the same industry means that investors anticipate high growth, while a low
P/E ratio indicates anticipation of low growth or even negative growth. Using other metrics, particularly those related to
the balance sheet, can help add more context to this measure.
Formula:
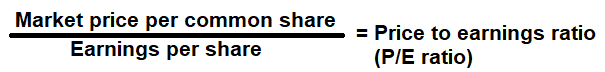
How to use this equation?
The values are commonly stated against Net Income and preferred dividend in the income statement and the weighted average shares outstanding in the balance sheet. To use this ratio, divide the market price per share by the company's earnings per share.Note:
Earnings Per Share = (Net Income - Preferred Dividends)/Weighted Average Shares Outstanding The values of Net Income and preferred dividend from the income statement and the weighted average shares outstanding from the balance sheet.
Stock Price:
The amount of money it will cost to purchase a share of a company through a stockbroker from secondary market.
Earnings Per Share:
It is portion of a company's profit that is allocated to each outstanding share of its common stock.
Example:
A company with a current market price of $20 per share with an earnings per share of $2 per share, then the P/E ratio is 10 times. It means the company stock is trading at a multiple of 10.
To learn more, try our - P/E ratio calculator
Dividend Payout Ratio
Financial metric used to measure; how much money does a company return to its shareholders and how much it is reinvesting in the company.
In other words, it measures the percentage of net income that is distributed to its shareholders.
A higher dividend payout ratio is an important part of the portfolio strategies of those investors who like
to have a steady income from their investments. Low dividend payout with no expansion may indicate trouble;
the same is true for high dividend payout in a growing company.
Generally, large or stagnating companies tend to have higher dividend payout ratios, while small or growing companies
tend to retain those earnings to reinvest in growth.
Formula:
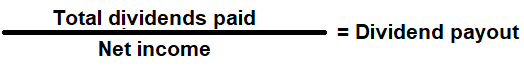
How to use this equation?
The values are commonly stated against Net Income and total dividends in the income statement. To use this ratio, simply divide total dividends by net income.Total Dividends:
Cash distributions that are paid over a period of time by the company to the number of outstanding ordinary shares issued.
Net Income:
Profit before deducting all its interest & taxes.
Example:
A company reported a net income of $100,000 for the year. In the same period, it issued $30,000 of dividends to its shareholders. Then its dividend payout ratio is 30%. It means it has retained 70% of its net income for reinvestment and paid out 30% of its net income to its ordinary shareholders in the form of dividends.